
Automatic IP Range Selection
Introduction
Grab a coffee and throw on your noise cancelling headphones because this project is a bit technical.
In designing a network, a network administrator will create smaller subsets of IP addresses called subnets. Subnetting allows data to be delivered more efficiently and helps users more proficiently utilize their network’s capacity.
A subnet’s location and size is represented by an IP Range or CIDR block, which is a string of numbers that looks like this: 192.168.1.0/24. Let’s dissect what these numbers mean.
The numbers to the left of the / (i.e. 192.168.1.0) define where the subnet is.
The numbers to the right of the / (i.e. 24) define the size of the subnet. Here, a large number represents a smaller network and a small number represents a larger network.
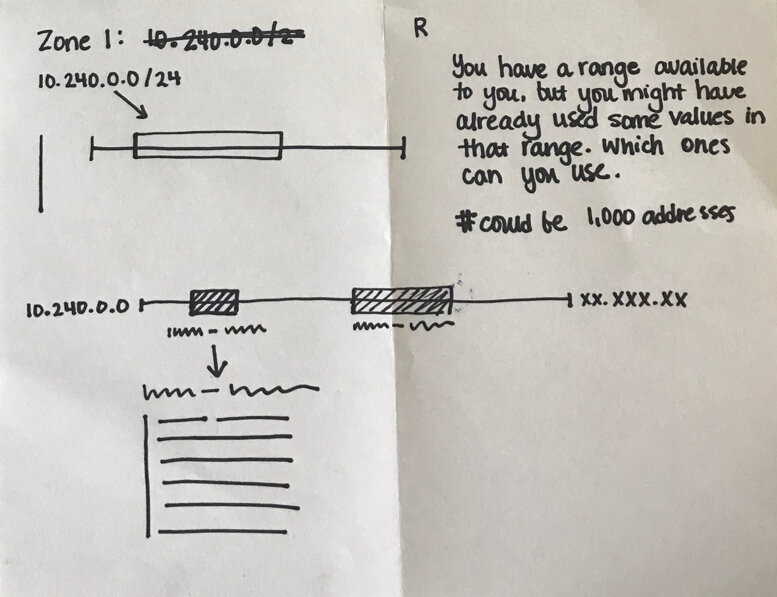
A finite address space contains a multitude of CIDR blocks and they cannot overlap. Thus, it’s critical to thoughtfully plan where CIDR blocks will be located in order to maximize space that is available in a network.
In this example, a network architect has defined three subnets in their address space. They want to define a fourth subnet at a particular size, but since they didn’t plan the space thoughtfully, there is not enough contiguous room for this fourth subnet.
The problem
Network administrators historically managed the locations and sizes of their CIDR blocks with spreadsheets, notebooks, and a lot of blind luck. Microsoft Excel even has a subnet calculation tool. As you can see, there is no visual element that would assist someone in making these important decisions.

These error prone processes could result in incorrectly designing a network IP address. That failure could be as simple as an inability to configure a printer on a network. More catastrophically, a misconfigured network could cause a system failure where a network would cease to function due to excessive traffic.
We partnered with our development team to identify this problem and together we pursued a need for a more accurate, faster, and easier way to determine and manage these addresses.
Pain points
Manually planning out a network is an inefficient use of available space.
Deciding the size and location of a CIDR block was difficult without visual feedback.
Solution
Our developers and design team worked together to co-create a solution that would drastically improve this critical process.
First, we explored a variety of different data visualizations to see which ones made the most sense to communicate the relationship between a CIDR block a user is trying to define, other occupied addresses, and the entire network. We looked at everything from candlestick charts, to histograms, to bullet graphs.
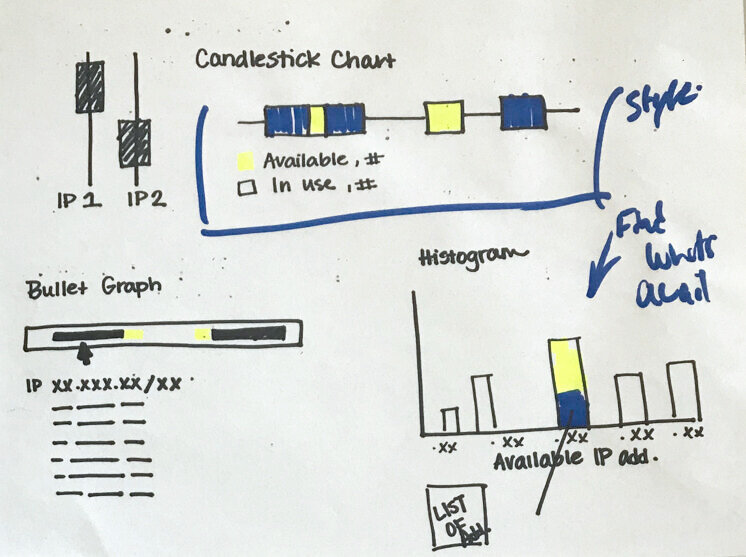
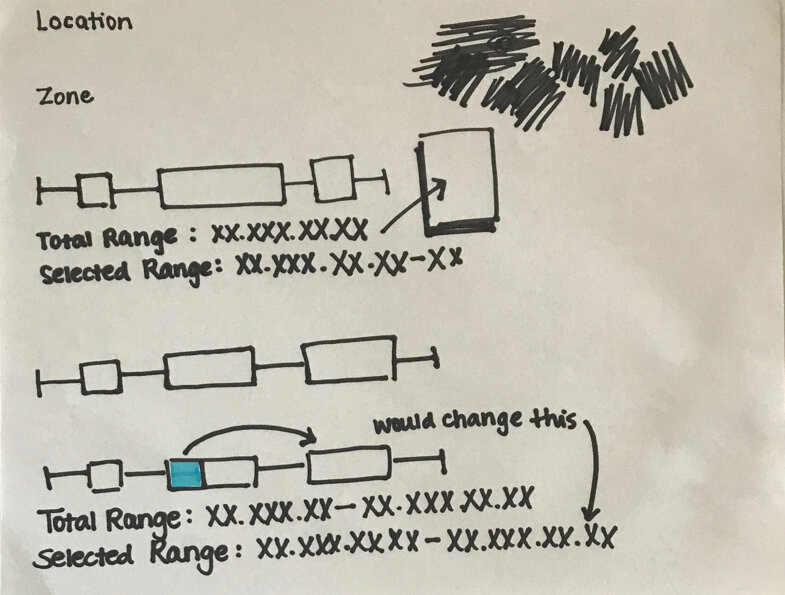
There was no singular data visualization mechanism that answered all of our needs, so we sketched out a hybrid of several different kinds of graphs.

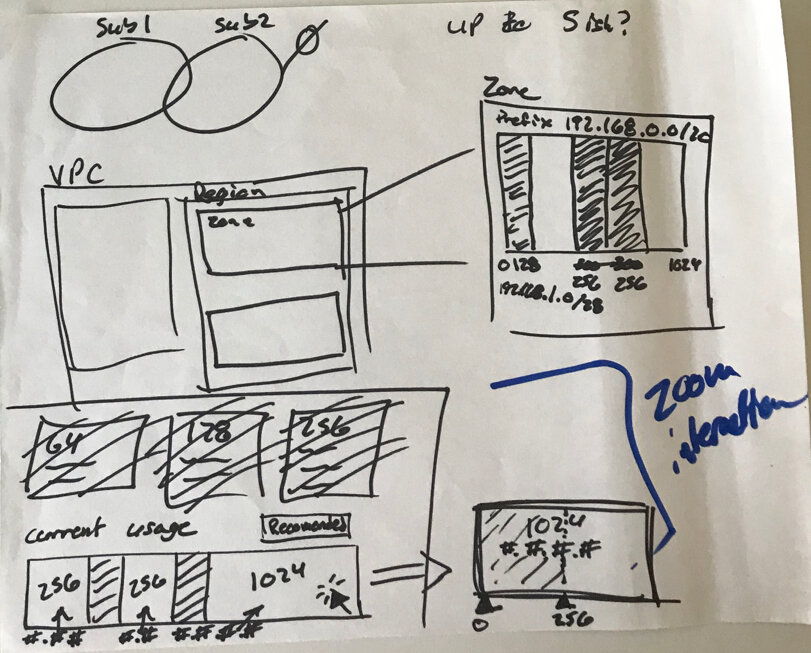
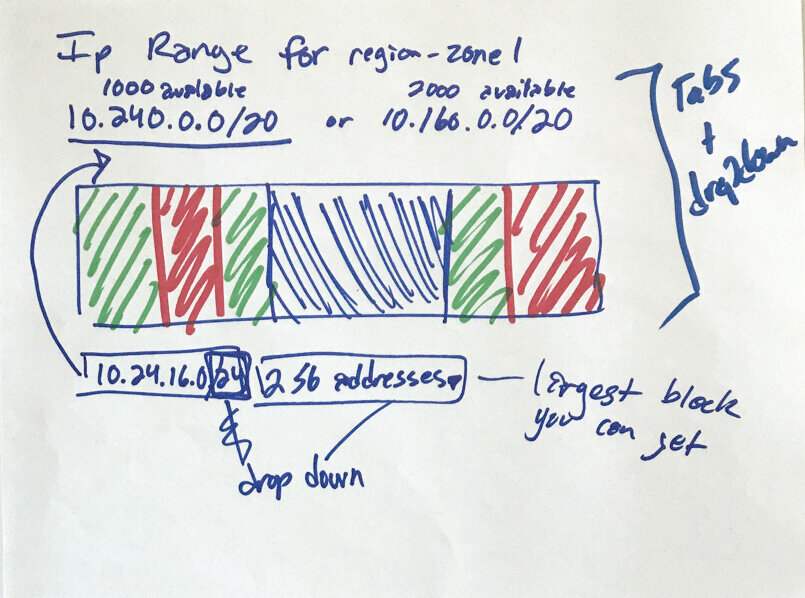
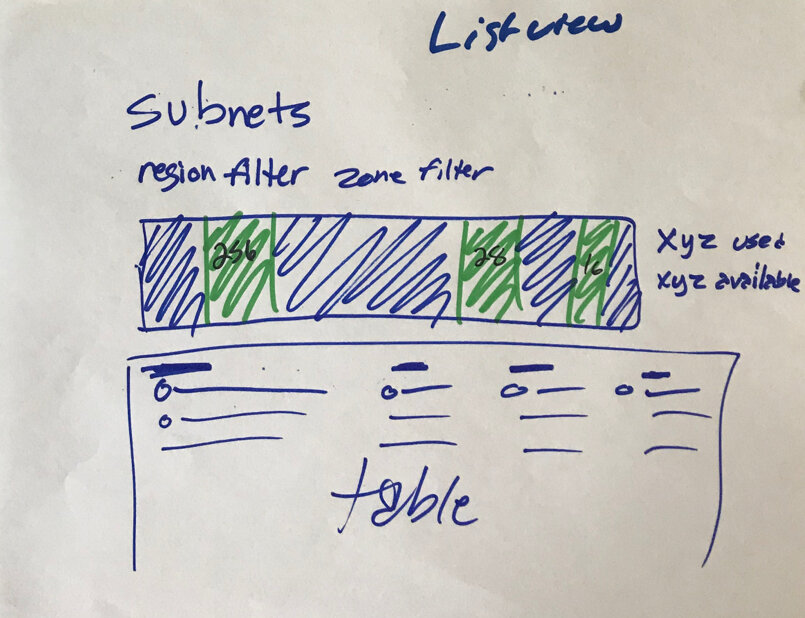
From here, we translated our sketches into some wires to share with our development team. Here are a few of our ideas that we proposed. With each round, our dev team was able to help us better understand what visualizations conceptually aligned with the technology.

After a couple months of meeting with our partners to concept, gather feedback, and iterate, we delivered this first release of our tool. Through our discussions with our dev partners, we determined that we should support both manual and assisted entry paths. In other words, we would recommend a logical location for the user’s preferred size of IP range but we also enabled them to override this suggestion with a different value (as long as it didn’t overlap existing reserved addresses).

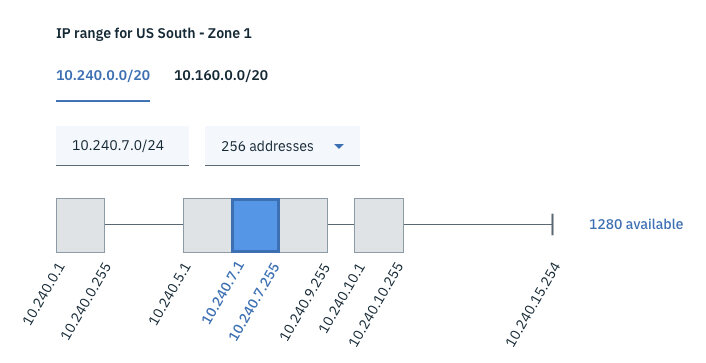
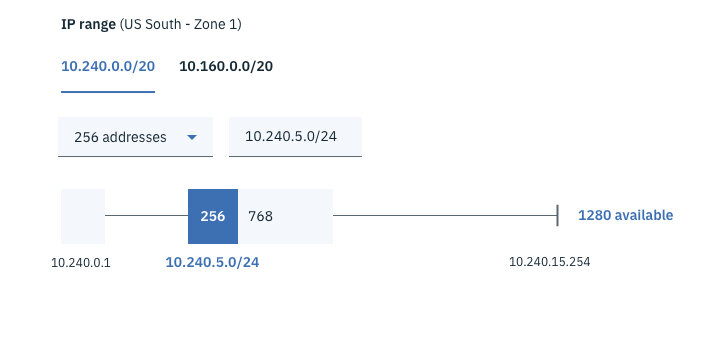
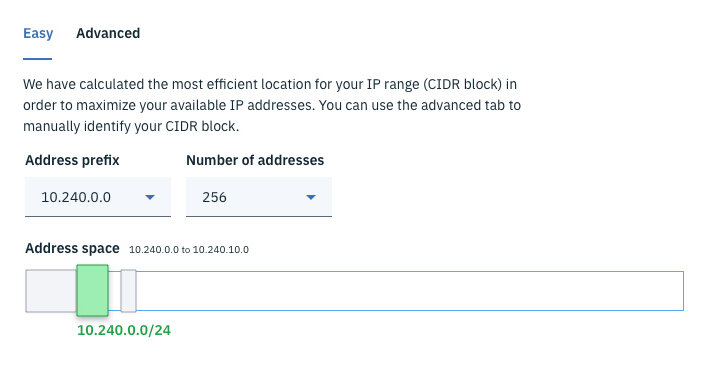
Here’s a breakdown of the anatomy of this tool.
“IP Range” text input: On the left of this tool, the user could configure their subnet by entering in their own IP range to see its size and location in the “address space” bar to the right.
“Address prefix” and “number of addresses” dropdowns: If the user needed guidance, they could select different values in the address prefix and number of addresses dropdown menus to similarly configure the size and location of their subnet.
Calculator icon: We used the calculator icon to help bridge the cognitive gap between the manual and assisted entry methods so that it was clearer that the user could use the tool to help them calculate their IP range.
“Address space” bar: The largest container represents the entire network. The dark grey boxes indicate unavailable IP ranges as they have been previously defined. The blue box indicates the current/proposed selection for the IP range.
After this first release, our users gave us some great feedback to make this tool more useful and clear:
I looked at this a hundred times and just realized what it is trying to show me. It is cool—I just didn’t get it [because the address space bar] looks like a text box to me. Now looking closely I can see it is slightly darker than a text box.
The value of the address space should be in the box below instead of shown to the right of the address space label.
Could you use color cues to help give explanations of address spaces that are occupied and address spaces that are available?
Note: we would also provide hover information wherever we indicated symbolism with color to accommodate color blind users.
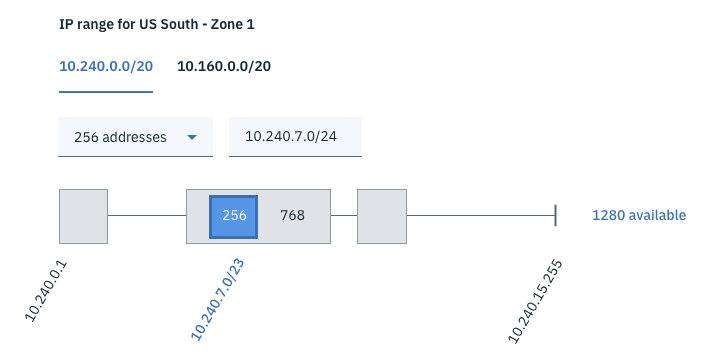
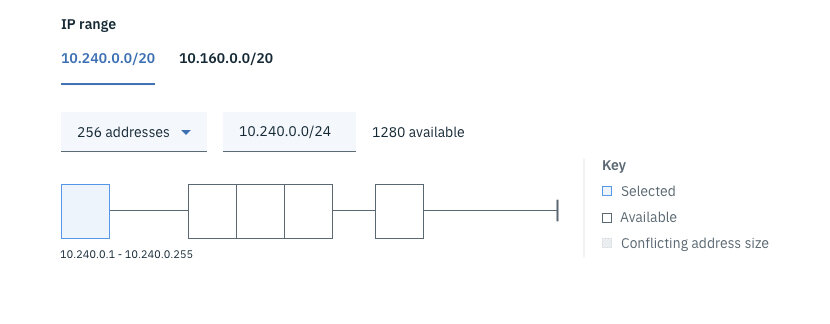
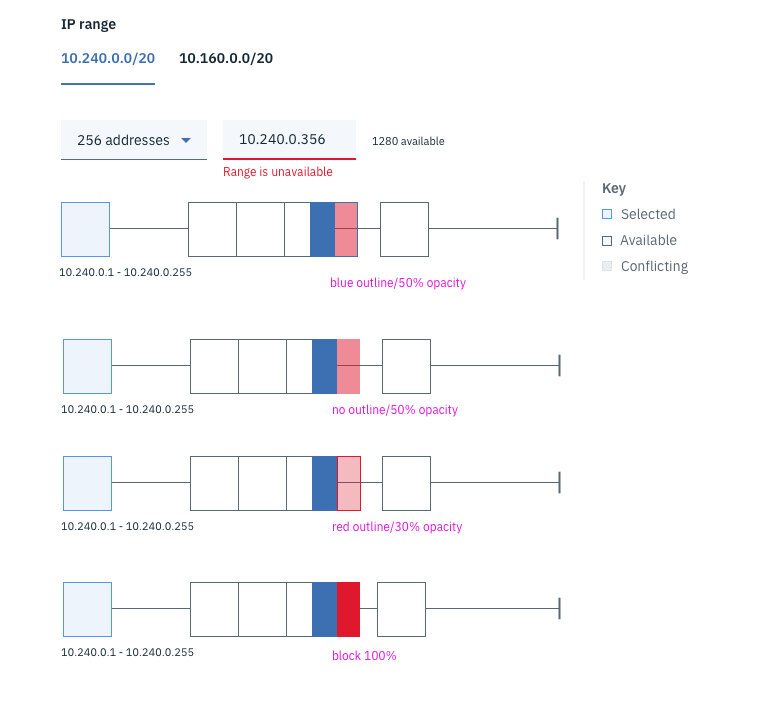
We reworked the tool to consider the feedback our users provided. Here are some of the explorations that helped us respond to the user comments.

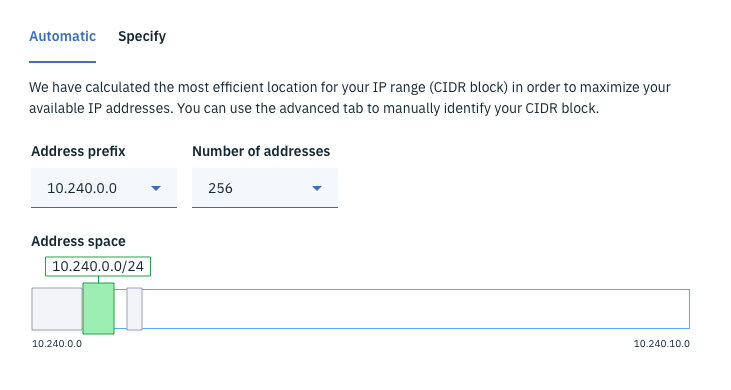
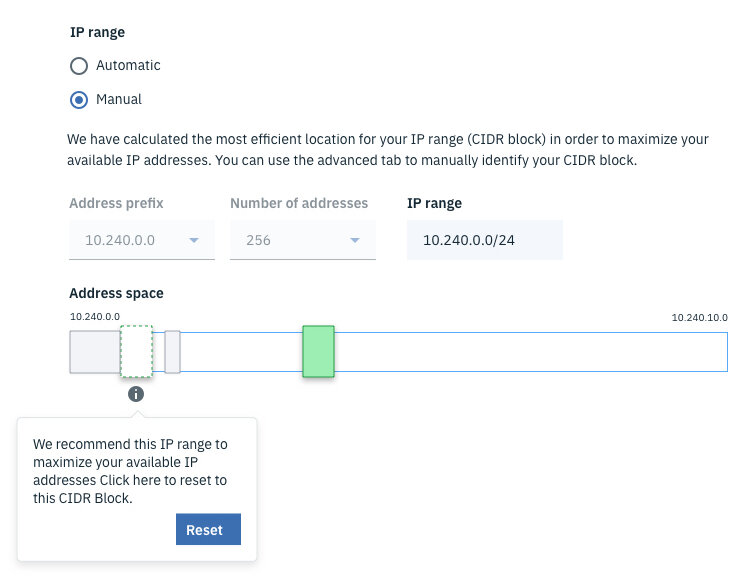
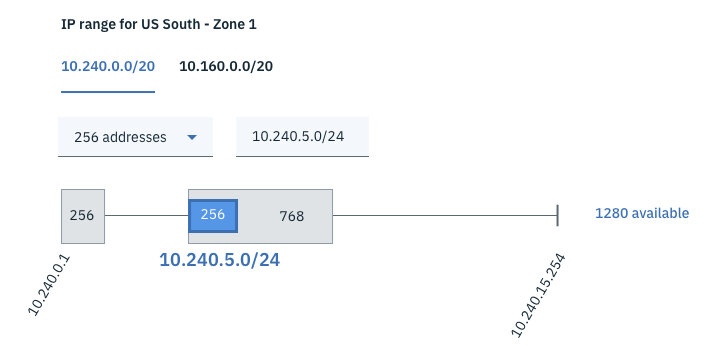
Our second release was much clearer and easier to follow. In addition to making the highlighted IP Range green, we made it larger than its container to emphasize the user’s focus. Moving the specific value of the IP range below the highlighted box also helped the user better understand what the box represented.

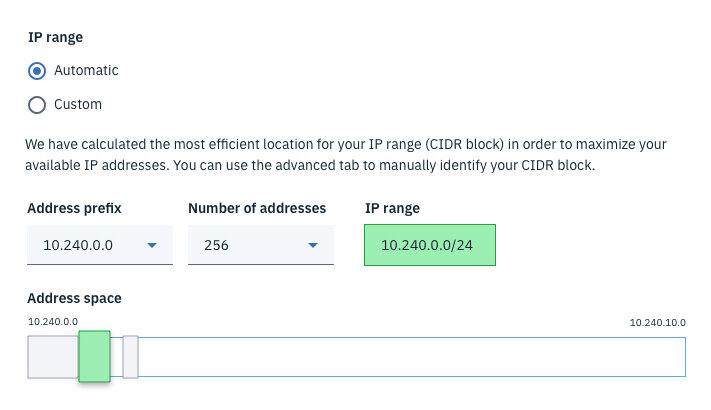
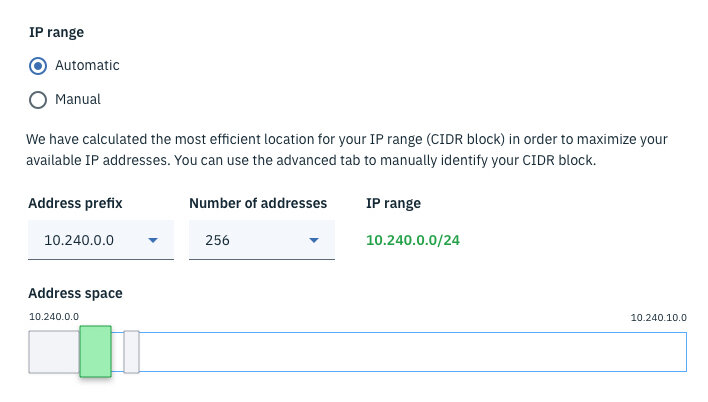
We have continued to iterate on this work to keep up with updates to our org’s design language and to respond to user feedback. Today, we have not only refreshed the visuals, but have also included motion to enhance the experience both when a user successfully defines an IP range and when they enter a value that conflicts with an existing range.
Value
The value of this tool becomes even more apparent as a network matures and has multiple occupied address spaces. Before the user engages with this tool, we prefill a non-conflicting IP range that fills the next logical “block” of the network. This is the value add that enables our users to easily maximize their network address spaces to accommodate maximum subnets.
Before using our tool, users might encounter a situation where there is enough cumulative space to accommodate an IP range, but poor planning resulted in no available continuous blocks that are large enough.
User testing
In coordination with our research team, we periodically test this tool using UserTesting.com to ensure we are continuing to refine its design and impact. Here’s some of our most recent feedback:
It’s very easy to select addresses based on my requirements. All I have to do is select a prefix and select how many addresses I need and it automatically calculates a range for me without me having to do anything.
I like that if I don’t want to use the suggested range, I can still override the selection and enter in a new value.
Everything made sense to me. It does it for me so I don’t have to think about it.
I would have liked to interact with the actual address space bar so I could click on where I wanted my IP range to be located.
This is a particular piece of feedback that we have had on our roadmap. Unfortunately, our blocker is that there are some technical constraints with API restrictions that limit this ability.
It gives you a good representation of this subnet and how it is being managed and used. It allows you to make the best choice on what IP range you want to use. I thought it was very useful.
This functionality addresses a problem that is highly technical and complex to understand. We continue to evolve our design as we understand more about our users and what enables them to be more productive and successful in our environment.